Online Operations Manual
Table of Contents
Setting up an analysis
This page is a tutorial for deploying a GstLAL low-latency analysis. For onboarding, users can follow these instructions to launch an analysis with a small BBH-only template bank. The workflow for production analyses is the same.
1. Clusters and accounts
To launch your own analysis you can use your albert.einstein account at any LDG compatible cluster.
Note: This tutorial is specific for an analysis on the Penn State cluster at ICDS. The production GstLAL analyses are run using shared accounts, see the overview page.
On CIT and ICDS the singularity bind paths are different. Bind paths are paths on the host filesystem that you want to still be available for reading and writing from within the container.
On ICDS we always bind /ligo eg,
singularity run -B /ligo <build-dir>
On CIT you don’t need a bind path, but we often bind $TMPDIR, eg
singularity run -B $TMPDIR <build-dir>
Additionally on CIT you will need a different profile than what is included in the o4a-containers:main container used below.
FIXME: currently we don’t have a dedicated profile for people to launch test analyses on CIT.
2. Build
The environments needed to run GstLAL low-latency analyses are defined by docker containers managed in the various branches at https://git.ligo.org/gstlal/o4a-containers.
These containers include an installation of GstLAL and all the dependencies needed for running the online analysis.
Each branch contains a configuration file specific to a particular analysis type (eg BBH-only analysis, early warning analysis, and so on).
The main branch of o4a-containers can be used to start up the small BBH-only analysis.
The docker containers are defined by the Dockerfile in each branch and are regularly published by the gitlab CI to stay up to date with the branch of GstLAL they are based on.
The container defined by the main branch is based off of the GstLAL master branch.
To build the docker image, run the following:
singularity build --fix-perms --sandbox <build-dir> docker://containers.ligo.org/gstlal/o4a-containers:main
This will pull a writable container into the directory specified by <build-dir>.
Note: we use singularity to pull and run containers instead of using docker. They are mostly interchangeable, but docker requires root priveleges which the average user won’t have on LDG clusters.
By making the image writable you will be able to make changes to the code installed in the image.
This is useful if you plan to do any dev work with the image.
3. Set up
Now that you have a build ready to use, it’s time to set up a run directory for your online analysis.
We will refer to this directory path as <run-dir>.
All of the necessary files to get started are included in the build.
Copy them over using this command:
cp -r <build-dir>/online-analysis/* <run-dir>
4. Authentication
Next, you need to set up influx credentials. InfluxDB is used to store data from the analysis, mainly for monitoring purposes. More information on InfluxDb can be found on the Monitoring page.
Choose a username and password, as well as a name for your influx database. These will be added to configuration files in the next section.
You will need to send your database name and Influx username/password combination to an Influx admin so that they can set up your new database:
INFLUX_USERNAME: <ANALYSIS SPECIFIC>
INFLUX_PASSWORD: <ANALYSIS SPECIFIC>
If you have a Grafana dashboard, you also need to send the database names:
INFLUX_USERNAME: <ANALYSIS SPECIFIC>
INFLUX_PASSWORD: <ANALYSIS SPECIFIC>
database_name: <ANALYSIS SPECIFIC>
If your analysis will run on CIT or PSU (ICDS), send them to ron.tapia, rebecca.ewing, or shomik.adhicary in a Mattermost direct message. If your analysis will run on UWM (Nemo), send them instead to duncan.meacher.
The admin will ensure that:
1. The Influx database is created.
2. The Influx user exists
3. The grafana reader, `gstlalreader` can access the Influx database.
4. (If requested) Your user on [the grafana website](https://gstlal.ligo.caltech.edu/grafana) is an "editor" so that you can edit dashboards.
You can continue setting up the analysis while the database and credentials are being provisioned, but the main analysis can’t be launched (step 9) until this is ready.
If you are running the analysis from your personal account, you will also need to create a suitable LIGO proxy:
ligo-proxy-init albert.einstein
5. Configuration
After copying files from the build in the Set Up step above you will have a config.yml which defines all of the input options of the analysis.
At a minimum you will need to change the following in your config.yml:
tag: a unique string to identify your analysisaccounting-group-user: youralbert.einsteinnamesingularity-image: your<build-path>INFLUX_USERNAMEandINFLUX_PASSWORD: the Influx credentials you made aboveX509_USER_CERTandX509_USER_KEY: the full path to your x509 proxy
If you know what you’re doing you can change other options in the config, but it’s not necessary.
Add the name of your influx database to the web/inspiral.yml:
db: REPLACE THIS WITH YOUR DB NAME
6. Generate Makefile
Now that your configuration is set you can generate a Makefile which will be used for the remaining steps in the tutorial.
singularity exec -B /ligo <build-dir> gstlal_ll_inspiral_workflow init -c config.yml
Profiles include specifications for the execute nodes your jobs will run on. They need to be installed on each cluster once. Check if your profile is installed:
singularity exec -B /ligo <build-dir> gstlal_grid_profile list
If it’s not, install it by running the following:
singularity exec -B /ligo <build-dir> gstlal_grid_profile install profiles/<profile.yml>
Note: You should ONLY use the profile which was included in the container you pulled. This is because resources are allocated specifically for each analysis type.
7. Pre-generated data products
You will need to download a template bank, mass model, reference PSD, and pastro model file.
The DCC document number and version are stored in the config.yml.
For the small BBH analysis, the DCC page is here: https://dcc.ligo.org/T2300144
Download the files by running the following:
source /cvmfs/oasis.opensciencegrid.org/ligo/sw/conda/etc/profile.d/conda.sh && conda activate igwn
make dcc-files
conda deactivate
Note: You will be prompted for your albert.einstein username and password in order to download the files.
8. Launch set up DAG
In this step you will generate a DAG which is used to create the following data products:
- Time slide files
- Split bank files (ie splitting the full template bank into smaller regions of parameter space, for use in generating SVD bins)
- SVD bank decomposition
- Ranking data files
To generate the DAG:
singularity exec -B /ligo <build-dir> make setup
And then launch the DAG:
condor_submit_dag online_setup_<analysis_tag>.dag
9. Launch analysis DAG
After the set up DAG completes, it’s time to generate and launch the main analysis DAG.
singularity exec -B /ligo <build-dir> make dag
And launch the DAG:
condor_submit_dag online_inspiral_<analysis_tag>.dag
10. Setup Grafana monitoring
FIXME
(Optional) Launch GW low-latency test suite
The Integrated Test Suite is a way to monitor the injection recovery of a low-latency analysis. This gives us a sense of the scientific validity of the analysis (for example, that sky localizations and source classifications match the expectations) as well as a measure of the sensitivity (for example, the surveyed volume-time, or SNR missed-found plots.) Monitoring the Test Suite dashboard can help us to identify problems that may arise with the analysis.
Once you have a low-latency analysis running (which processes injections and uploads them to GraceDB), you can follow the instructions in the Test Suite config repo to launch a Test Suite DAG and corresponding Grafana dashboard.
Monthly update of live injection sets
The injection cache frame is updated monthly on streaming (see section 9. low-latency injections for detail). To match up the live-injection events in each month, we need to update our injection table in the test-suite. Therefore, at the end of each month, the injection database needs to be updated with the next month’s injection file. These injection files of all months (from July 2024 to Apiral 2025) have been converted from HDF5 format to XML format and left in the ~/<analysis-dir>/test-suite/injections/ for Edward, Jacob, Rick, and Bob. If you want to get the original HDF5 files generated by Reed, you can find them at /scratch/reed.essick/rates+pop/rpo4-injections/online-injections/.
Move all the submit files and dag-related files to backup folder.
mkdir backup/backup_YYYYMMDD
mv *sub test_suite_* backup/backup_YYMMDD
Update the injection database in config.yml:
injections: injections/rpo4-<year>_<month>-1401235456-2591232/rpo4-<year>_<month>_000-1401235456-2591232.xml.gz
e.g. for July 2024, the format is rpo4-2024_07-1401235456-2591232/rpo4-2024_07_000-1401235456-2591232.xml.gz
Remake and launch the dag
make launch
Relaunch Online Analysis
The low-latency analysis should be removed once per week in order to compress files (reducing memory) and update the credentials. For this, or any other time you want to remove and relaunch the analysis follow these steps:
cd <run-dir>
condor_q -dag
condor_q -dag will give you the DAG ID of your analysis. Then:
condor_rm <dag-id>
To re-launch:
condor_submit_dag online_inspiral_<analysis_tag>.dag
You can tail the output of the DAG to check for possible failures:
tail -f online_inspiral_<analysis_tag>.dag.dagman.out
Resume an Online Analysis
Resuming an online analysis is useful when you need to bypass the burn-in period or create a branch of an existing online analysis to test new features. This is the fastest way to deploy an SCCB Test analysis and validate new builds.
A resumption copies over all relevant files from the original analysis and updates the Influx credentials automatically.
To resume an online analysis:
- Create a new directory for the resumed analysis.
- Copy the
Makefile.resumeinto that directory. - Update all required variables in
Makefile.resumeto point to the original analysis and any new configuration. - Run the appropriate
Makefile.resumetargets to complete the setup. - Run
gstlal_ll_inspiral_workflow create -c config.yml --workflow inspiral.
Update Online Analysis after SCCB Approval (as of O4a)
Tagging the production branch
After SCCB approval for your changes, you must make a new tag of the running branch.
To do so, head to the tags page and click New Tag in the top right. Then, name your tag, and add the hash for the last commit on the branch you want to tag as the origin.
We have been using the convention MAJOR_CHANGE.FEATURE_UPDATE.BUG_FIX for 0.0.0 tag numbers with an appropriate string in front.
For example, when adding the dtdphi plotter feature, the o4a branch went from allsky-o4a-online-v1.0.4 to allsky-o4a-online-v1.1.0 while adding a bugfix to reading frames from disk made the tag go from allsky-o4a-online-v1.0.1 to allsky-o4a-online-v1.0.2.
Updating the container repo
After tagging the branch, you also have to update the singularity container repo, so that the new changes will be reflected in the container you pull when you go to deploy your changes.
The O4a container repo is here. Depending on the analysis you want to update, you can choose that analysis by branch name. Changes to all-sky analyses have to be applied to both the Jacob and Edward branches.
To update the tag name, go to the appropriate branch, and change the first line in the Dockerfile to point to the new tag. In our previous example of adding the dtdphi plotter, the line would get changed as follows:
Original
FROM containers.ligo.org/lscsoft/gstlal:allsky-o4a-online-v1.0.4
Updated version
FROM containers.ligo.org/lscsoft/gstlal:allsky-o4a-online-v1.1.0
Changes to the container repo will propogate to the clusters every midnight, or you can force an update by running the CI pipeline.
Re-deploying your changes
Now that all of the updates are in place, you may want to actually deploy your changes in the running analyses. To do so, first make a new singularity image in the builds directory using the new container you just changed. Builds should be named as ANALYSIS-TAG_GIT-HASH-OF-TAG. Where GIT-HASH-OF-TAG should be the shortened hash of the commit you just tagged. For example: gstlal_jacob_o4a_2cfb318a.
Then, head to your analysis dir, and change the singularity-image line in the config. Then, remake the dag before relaunching. By remaking the dag, the new singularity image will now be used by all of the jobs.
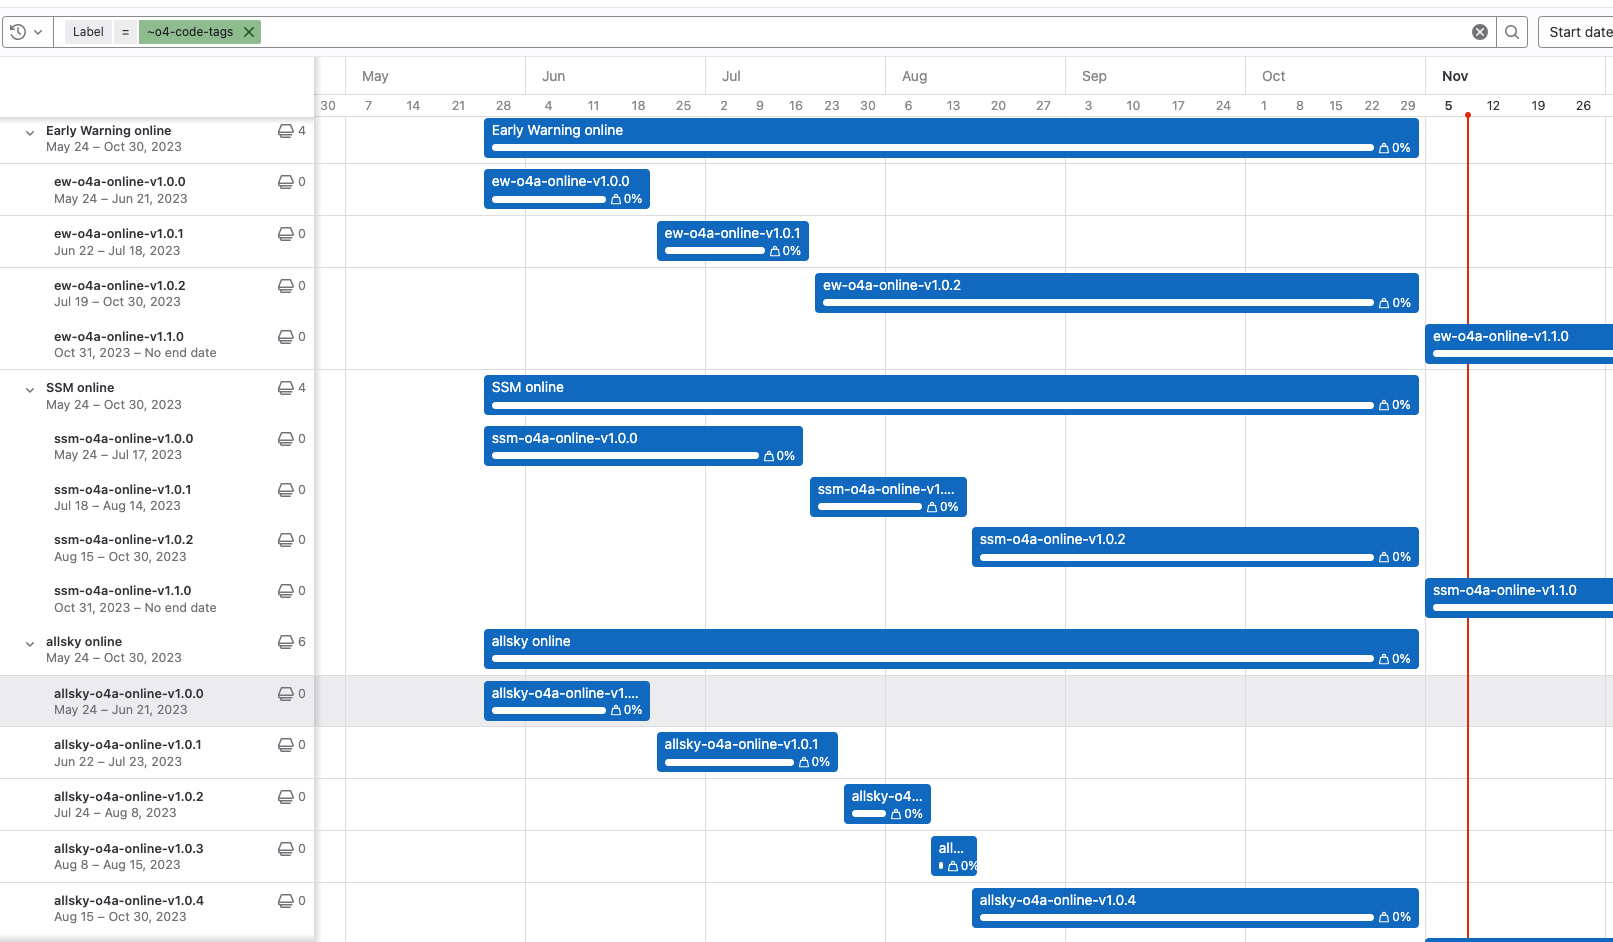
Update the tag history in the Gantt chart
We keep track of the tag history in the Gantt chart under gstlal namespce of gitlab, i.e. here. Anyone that has deployed a new tagged build is responsible for updating the Gantt chart.
- Add a new epic associated with the new tag in a parent epic for each all sky, SSM and Early Warning. Make sure the new epic has
o4-code-tagslabel, otherwise it won’t show up in the Gantt chart. - Paste to a link to the relevant SCCB ticket and set the start date to be the day when the build gets deployed.
- Set the end date of the epic with previous build to be the same day or the day before.
- Double check the Gantt chart is updated appropriately.