Online Operations Manual
Table of Contents
Maintaining
We will maintain the low-latency analysis in week long shifts of three people at a time. Beginners or people who want to learn about the analysis can sign up as Responder 3, people with intermediate knowledge about the pipeline are Responder 2, and experts are Responder 1.
ROTA shifts begin and end on Thursdays at the PSU sprint planning meeting. ROTA members should typically avoid taking on development tasks during their shift so they can focus on montitoring and triaging any problems that may arise with the analyses during their shift.
Overview of Maintainer Responsibilities
All ROTA members are responsible for the following items during their shift:
- Continually check the status of the DAG and dashboard
- Participate in launching/removing the dag when necessary (eg. regular maintenance)
- When taking doen the analyses, click on “Downtime” on the Icinga alerts tab of the related jobs. Set the end time to be 1 hour after the scheduled maintenance end time as it has been observed that some of the nodes can be unstable right after maintenance.
- Attend relevant calls:
- Daily RRT calls (during O4)
- LL call Wednesday, 9 AM EST
- Participate in the event follow-up (see checklist)
- Fill out your portion of the weekly ROTA issue page https://git.ligo.org/gstlal/projects/-/issues/
- Participate in weekly documentation sprint while analysis is down for maintenance.
Responder 1
- Ultimately responsible for the health of the analysis.
- Respond to Nagios alerts as quickly as possible.
- Do their best to communicate with responder 2,3. e.g. be available on zoom during any debugging, etc.
- Give updates on analysis status at relevant calls.
- Fill out weekly issue page:
- Lead event follow up (even in the middle of the night) (See checklist).
- Identify and fix problems in the analysis as they arise.
- Record notes about analysis status.
Responder 2
- Always alert the first ROTA team member when any problems or questions arise.
- Responsible to monitor the online dashboards and check condor dag and logs to search for failures.
- Responsible for contributing to documentation - this is a great way to learn about the analysis which should be a main focus during the shift.
- Sign up for GraceDB alerts.
- Help with error tracking - log in daily and check DAG files for recent failures.
- Help with event follow-up.
Responder 3
- Responsible for monitoring the online dashboards and learning about each of the panels/metrics displayed.
- Responsible for contributing to documentation - this is a great way to learn about the analysis which should be a main focus during the shift.
- Sign up for GraceDB alerts.
- Shadow the other responders on error tracking and event follow up.
Links for ROTA members:
- GraceDB:
- Public Alerts User Guide.
- Main Analysis Dashboard
- Definition of Extraordinary events
- GraceDb alerts set up- https://gracedb.ligo.org/alerts/
- GWCelery.
- Status of the detectors: online.ligo.org
How To
The following are examples of ways to monitor the analysis but is not an exhaustive list.
Following up Icinga Alerts
Icinga alerts are associated with the dashboard at https://dashboard.igwn.org If you are signed up as an anlysis ROTA responder, it’s important that you subscribe to these alerts and follow up on them when they occur. If you’re not available to follow them up yourself, please ping someone else! You can find more information about the Icinga alerts on the Monitoring page.
Icinga alerts will tell you which jobs are “down” according to the test that was done (http or influx). It’s important to remember that a “down” job does not necessarily mean a condor failure– there are many reasons why the job may not be outputting data as expected and that should be followed up on carefully. One can mark the Icinga alerts as “Acknowledge” to prevent Icinga alert emails from being sent while you look into the issue. Click on “Acknowledge” on the Icinga alerts tab of the related jobs. The “Acknowledge” state continues until the job becomes OK state. Here are some steps to identify/solve issues when these alerts come up:
- Log into the
gstlalcbc.onlineaccount for CIT analyses and thegstlalcbcaccount for ICDS analyses. Navigate to~/cronwhere you will see bash scripts like the following:
~/cron/inspiral_o4_<analysis_name>.sh
Run this script and see that you can verify the output from the email alert, if not there may be some upstream problem. 2. Check the dagman.out for recently failed jobs. If there are recent failures corresponding to the down jobs from step 1 you can check the logs and go from there. Even if the jobs aren’t failing, you can still check the logs to see if there’s a clue there (for example logs associated with failing to get data, failing to connect to kafka, etc.) You can find the right log file by using the condor job id, for example:
condor_q -dag <dag_id> -nobatch | grep “job-tag 0000_noninj”
less logs/*<job_id>*.err
- Look up the jobs on the job-specific dashboards on Grafana to verify that there is no influx data for them.
- Try getting data from the jobs via bottle. This uses HTTP and is completely independent from Kafka/Influx. For example:
cat 0000_noninj_registry.txt
wget <url>/ram_history.txt
Check how recent the latest timestamp from bottle is:
tail ram_history.txt
singularity exec <build> python3 /home/gstlalcbc/observing/4/dev/runs/convert_time <time>
If the timestamp is old then the job isn’t producing data as it should, it is probably hanging or stuck somehow.
- Try querying kafka directly for data from the “down” jobs:
singularity run /home/gstlalcbc/observing/4/dev/builds/scimma_client.sif
kcat -C -b <broker> -t gstlal.<tag>.ram_history -o -1 -K :: | grep “0000.noninj”
If the job is working well, there should be a constant flow of data there.
Remember that if you’re querying an injection job the topic has an ‘inj_’ prefix, eg inj_ram_history
- Make a note of the execute node the “down” jobs are running on:
vim online_inspiral_<analysis_tag>.dag.nodes.log
Search for the condor job_id in this file and look for lines that say “job executing on host”, eg:
001 (848796.000.000) 2023-04-15 09:43:29 Job executing on host: <10.14.4.209:9618?addrs=10.14.4.209-9618&alias=node959.cluster.ldas.cit&noUDP&sock=startd_2051866_fcd2>
In this example the job is running on node 959. Look for patterns in the nodes: are several of the down jobs running on the same set of nodes? This can indicate a problem with the nodes themselves.
You might not have to follow all of the above steps, but if jobs are being marked as “down” by Nagios and not failing out, you should at least try to track down the source of the issue, take note of the execute nodes, and it is probably safe to restart those jobs (condor_rm <job_id>).
Although, the second and third responders should always check with the first responder before killing jobs!
Check Analysis Dashboards
Things to look out for on Grafana dashboards:
- Main/ Injections dashboard:
- SNR histories for all observing IFOs. Make sure there is SNR history for each IFO in “science” mode (check that this matches the state according to online.ligo.org.
- Likelihood and FAR history panels are populated (if the analysis has burned in).
- Sanity check IFAR plot.
- Check latencies, particularly, keep an eye on median latency. If it goes above ~15s - there could be a problem and this should be followed up on.
- RAM history - should stay below 4GB.
- Job specific dashboards:
- Follow up on problem jobs by selecting the SVD bin from the drop down menu.
- Test Suite dashboard:
- Check decisive SNR panel for high SNR missed injections, if there are any follow up on them. If there is a long period of time where there are no found injections:
- check latest gracedb uploads to make sure the analysis is successfully uploading events.
- check test suite jobs:
igwn_alert_listener,inspinjmsg_find, andinj_missed_foundfor errors. - check status of event uploader jobs.
- check the injection recovery and VT panels. If these are not populated since the end of last month, update the injection database based on this instruction
- Check decisive SNR panel for high SNR missed injections, if there are any follow up on them. If there is a long period of time where there are no found injections:
Check Condor Status of Analysis
Some useful condor commands:
condor_q: run this to check overall status of the DAG. See that ALL jobs are running. If any are idle or on hold - find out why.condor_q -dag <dag_id> -nobatch: show status of all jobs in the DAG- add
-idleor-holdto see only idle/held jobs.
- add
condor_q -better-analyze <job_id>to see why a job is idle- Finding logs of a particular job:
- If you know the job name (ex.
gstlal_ll_inspiral_event_uploader:condor_q -dag <dag_id> -nobatch | grep <job_id>less logs/*<job_id>*err
- For an inspiral job with a known job tag:
condor_q -dag <dag_id> -nobatch | grep "job-tag 0000_noninj"less logs/*<job_id>*err
- If you know the job name (ex.
- Find the execute node that a job is running on:
- get the job id from the commands above
grep <job_id> online_inspiral_dag.dag.nodes.log | grep "executing"
Check GraceDB uploads
Interacting with GraceDB:
- Subscribe to alerts.
- Query gracedb latest page for events with the following queries:
- search for events or retractions (in a time range):
far<3.8e-8 pipeline: gstlal created: 2022-09-06 .. 2022-10-04 - search for injections:
si.channel = "GDS-CALIB_STRAIN_INJ1_O3Replay" | si.channel = "Hrec_hoft_16384Hz_INJ1_O3Replay" pipeline: gstlal - use
search: AllSkyfor Edward or Jacob orsearch: EarlyWarning - put in the correct time period in the ‘created’ section
- you can also filter by submitter to separate Jacob uploads (
submitter: gstlalcbc_icds) from Edward uploads (submitter: gstlalcbc)
- search for events or retractions (in a time range):
Event follow up check-list
- Is the event high significance or high profile?
- Check q-scans around the time of event.
- Check SNRs and chi-sq to see if it looks like a reasonable event.
- Check all dashboards around time of event to see if analysis is producing trustworthy results.
- Check background plots on GraceDB for uploaded event, specifically for background contamination.
- Responder 1 or 2: remove counts if the event passes the OPA threshold of 1 per 10 months and isn’t a retraction.
- If the event is not Extraordinary, make sure that the automatic alert was sent out. In case of an extraordinary event, make sure an RRT call was set up.
- If the event is retracted, create a git issue under retraction epic and put together as much information for a given retraction as possible (e.g. gracedb event page, alert, dtdphi plot, LR terms). See this as an example.
Turn on GraceDB uploads through bottle
Go to the run directory and run the following command to set the GraceDB false-alarm rate upload threshold to 2.78e-4 Hz (1/hour).
singularity exec <build-dir> make set-far-thresh
Qscan generation
One may want to generate a q-scan to check the noise energy around the time of events and (missed) injections. Here are instructions on how to generate qcans given a time (in UTC).
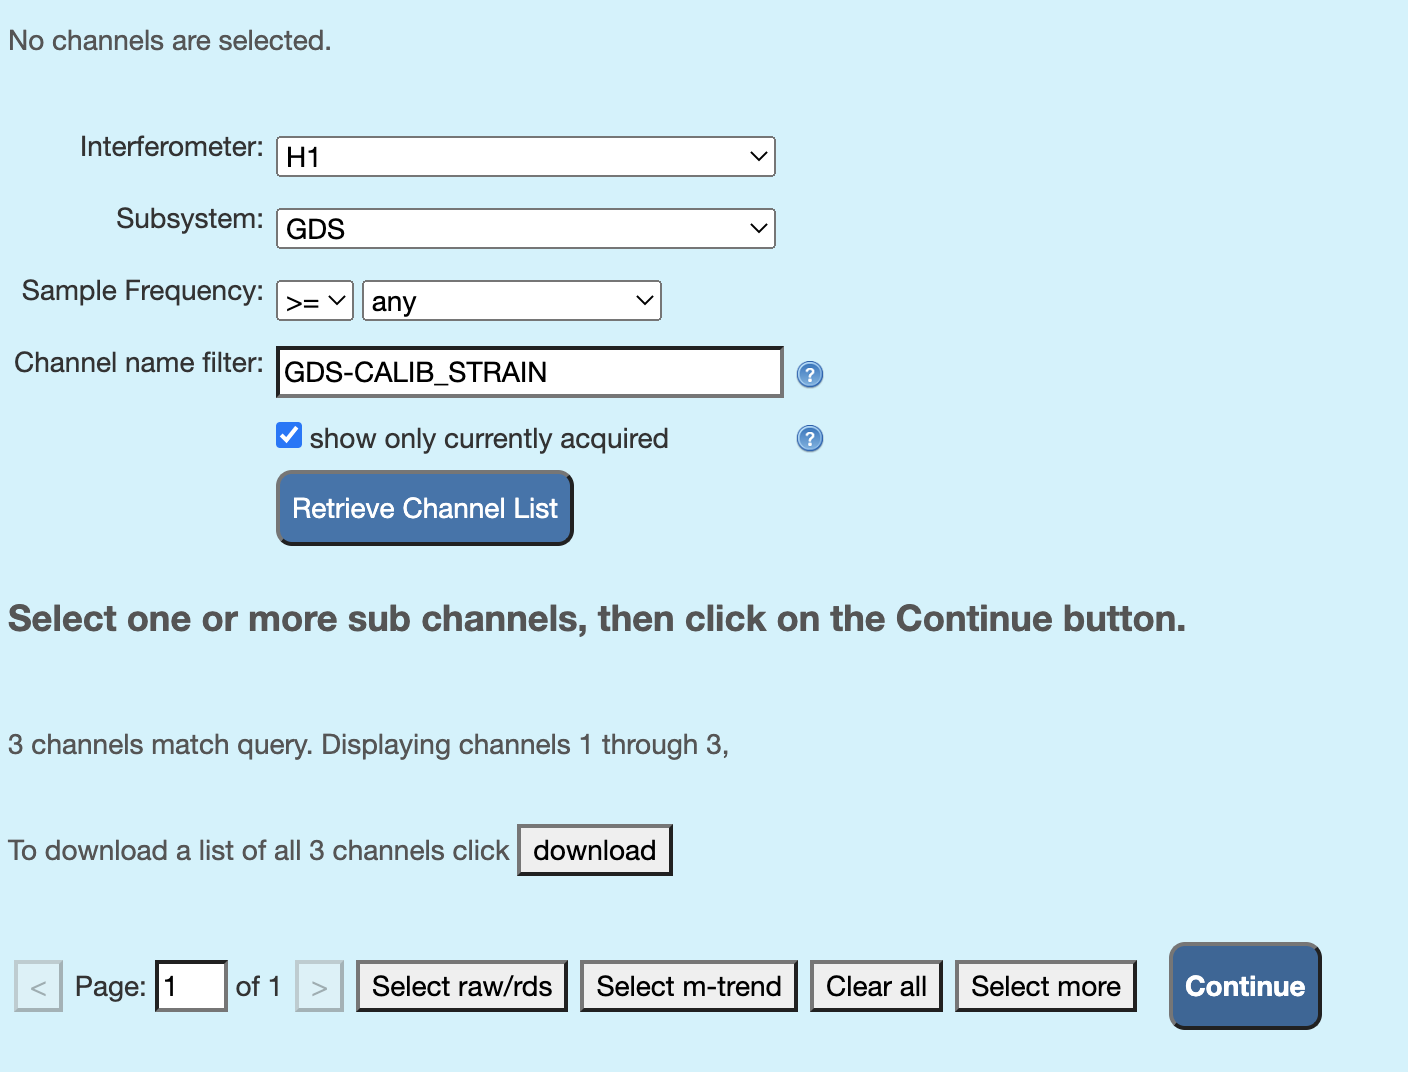
-
Go to LIGO DV-Web and enter the interferometer names, subsystem (should be “GDS”), sampling frequency, and the channel name (i.g., “GDS-CALIB_STRAIN for LIGO”), as shown in the screenshot below, and click on “retrive channel lists”.
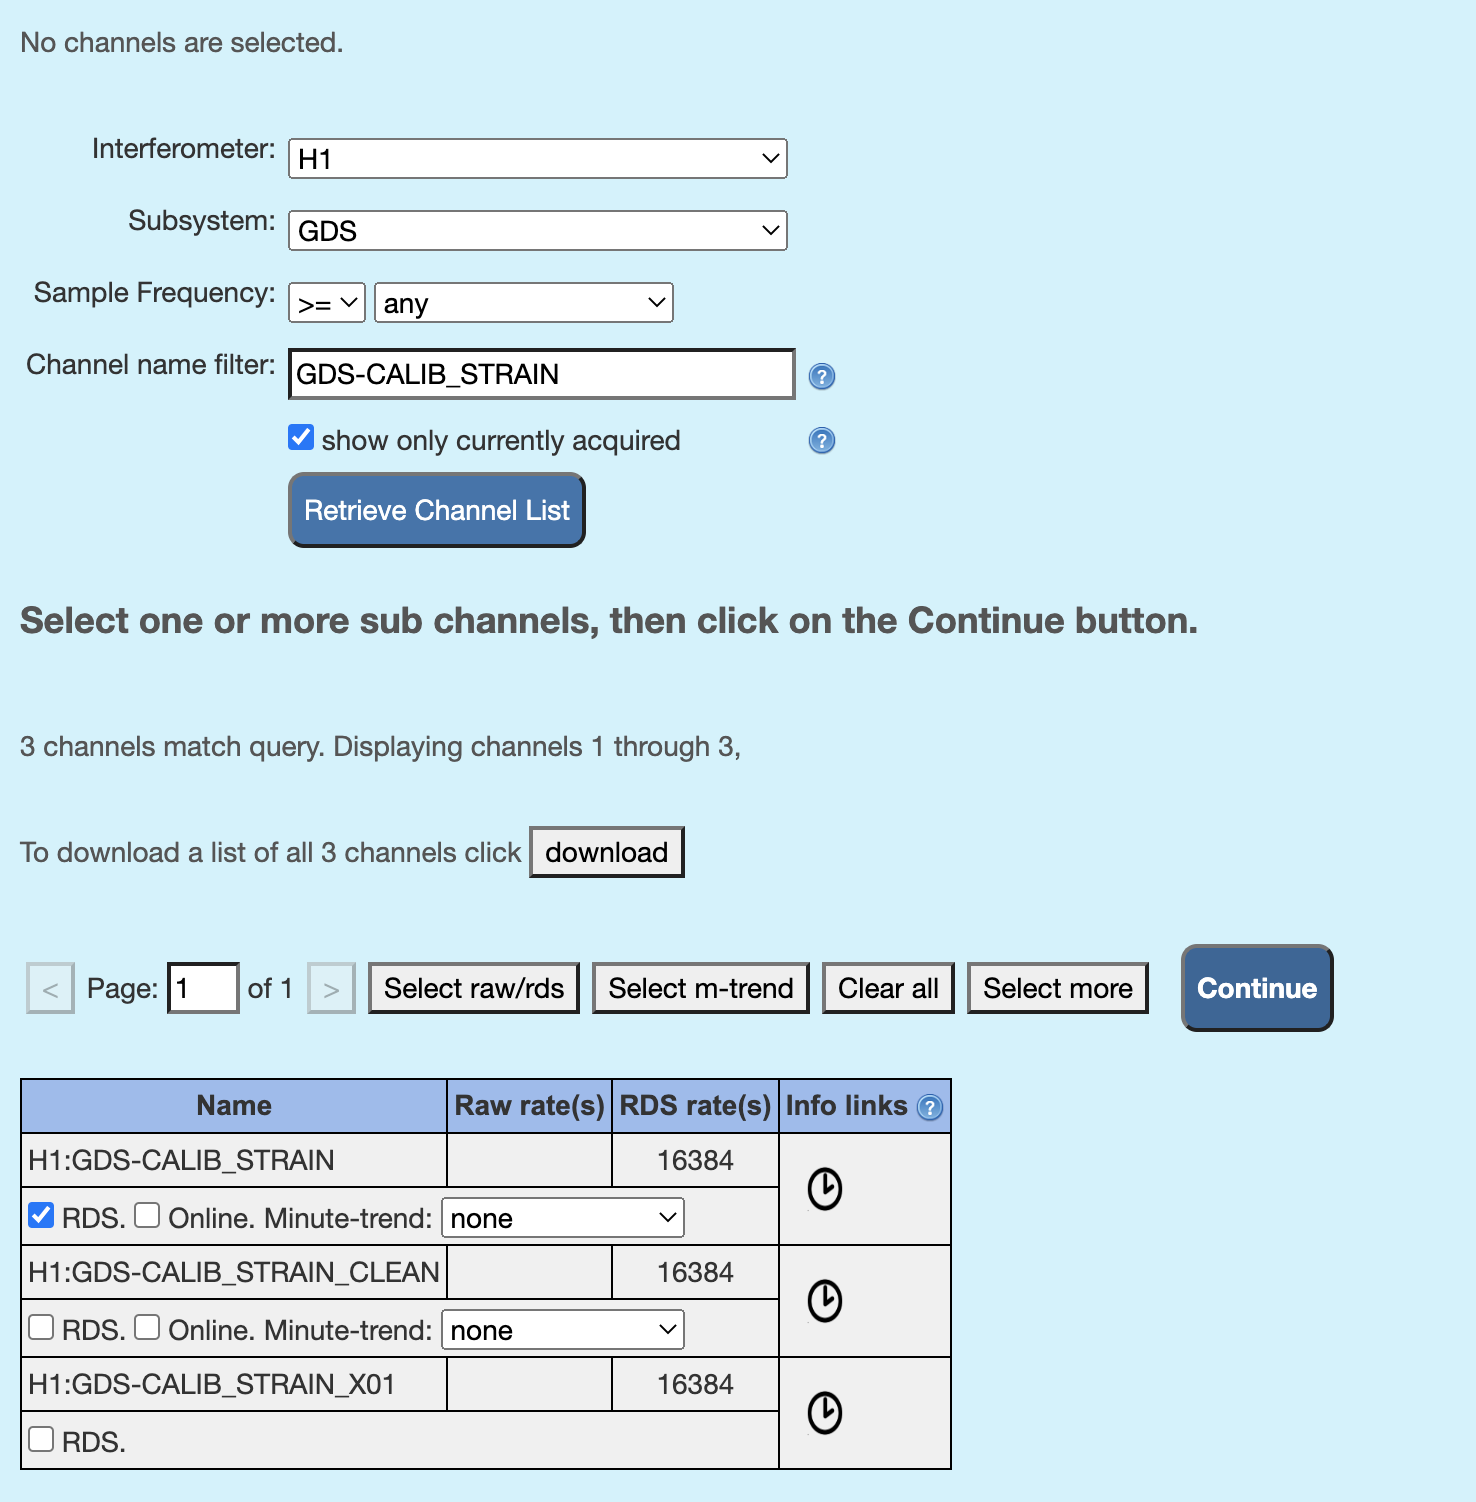
-
Check off “RDS” for channels you like to run omegascan in the table that appears on the bottom of the page, like in the screenshot below, and click on “continue”.
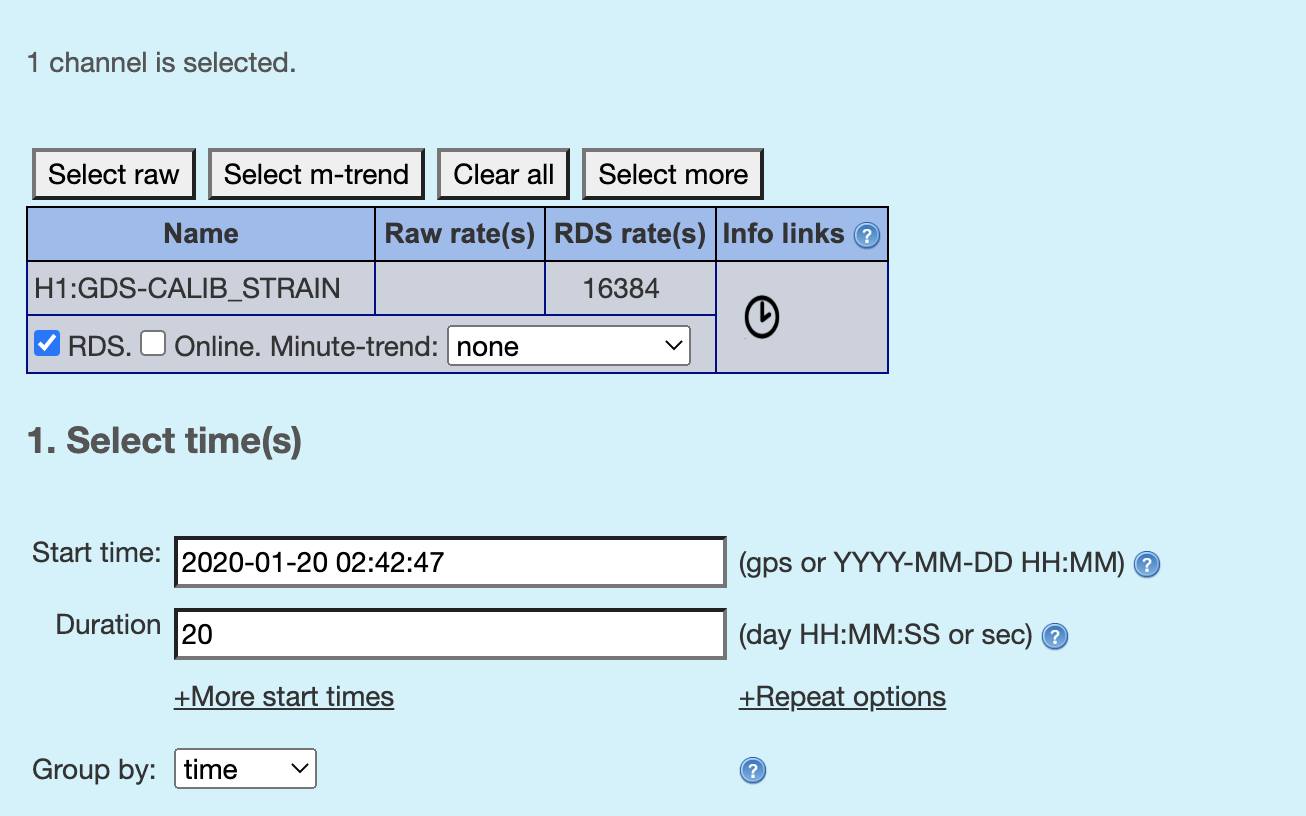
-
Pick the timestamp and duration for which to plot. You can convert the MDC time to the O3 real time by referring to this table or convert the MDC UTC GPS time to the O3 observation time using the offset in this page and then convert gps time to UTC (or other way around) using this link (or any other way).
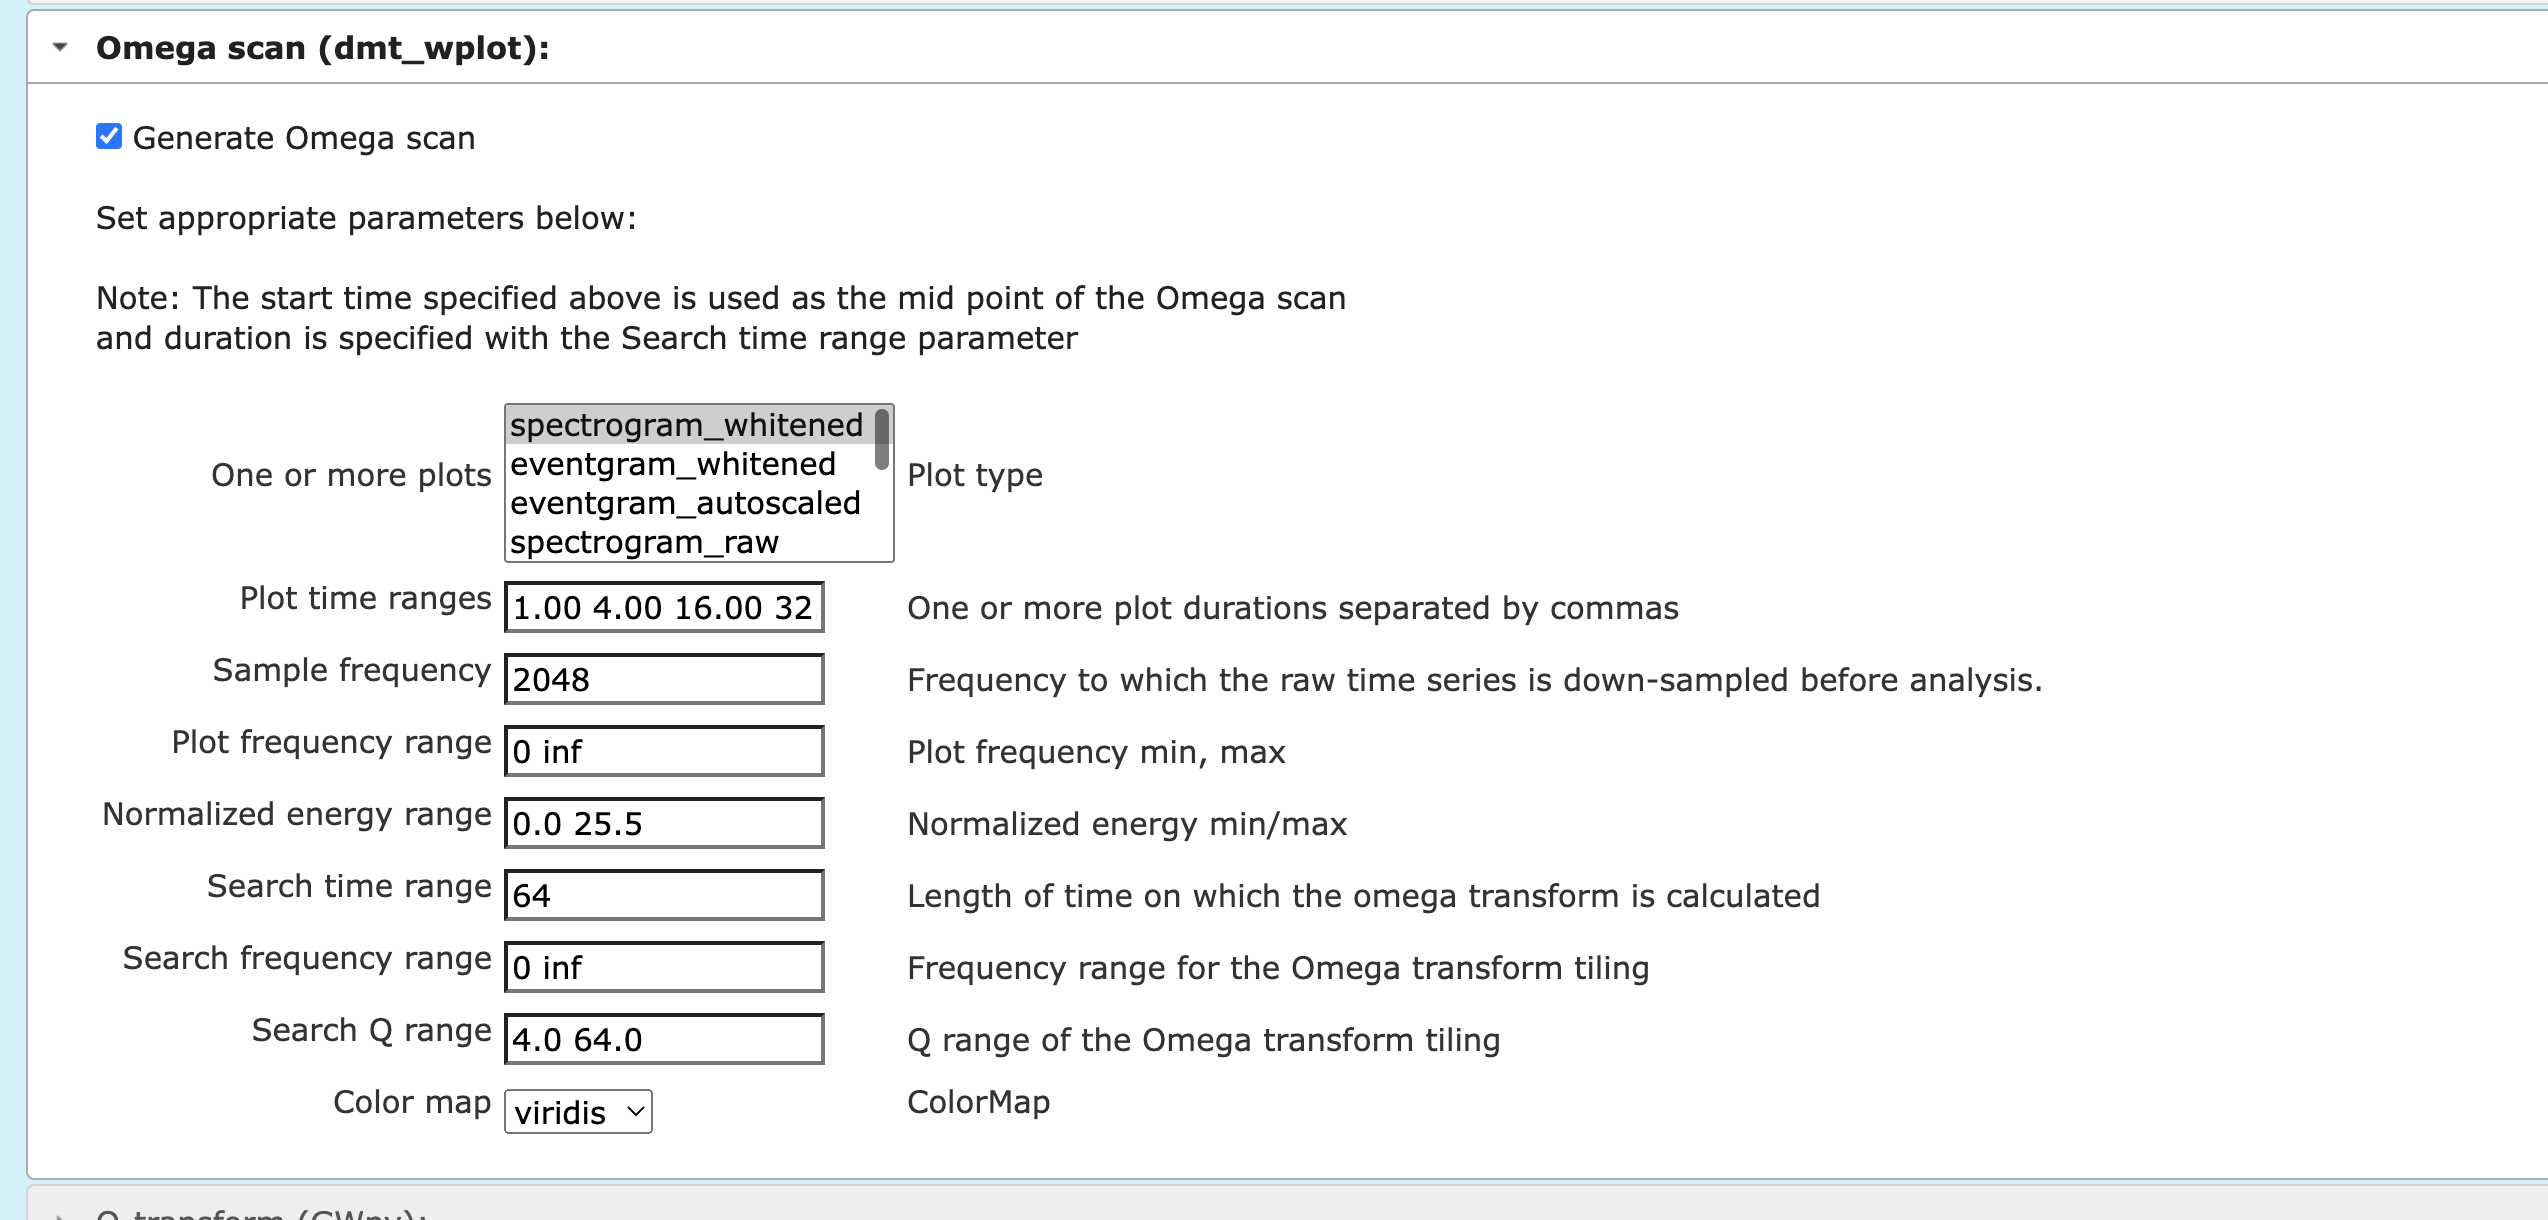
-
Pick the omega scan from the dropdown items as shown in the screenshot below. One may tweak the parameters, but try using the default values at first. Then at the bottom of the page, click on either “Plot: same window/tab” or “Plot: new window/tab”. One may download the plots.
-
Finally, one will get plots like the screenshot.
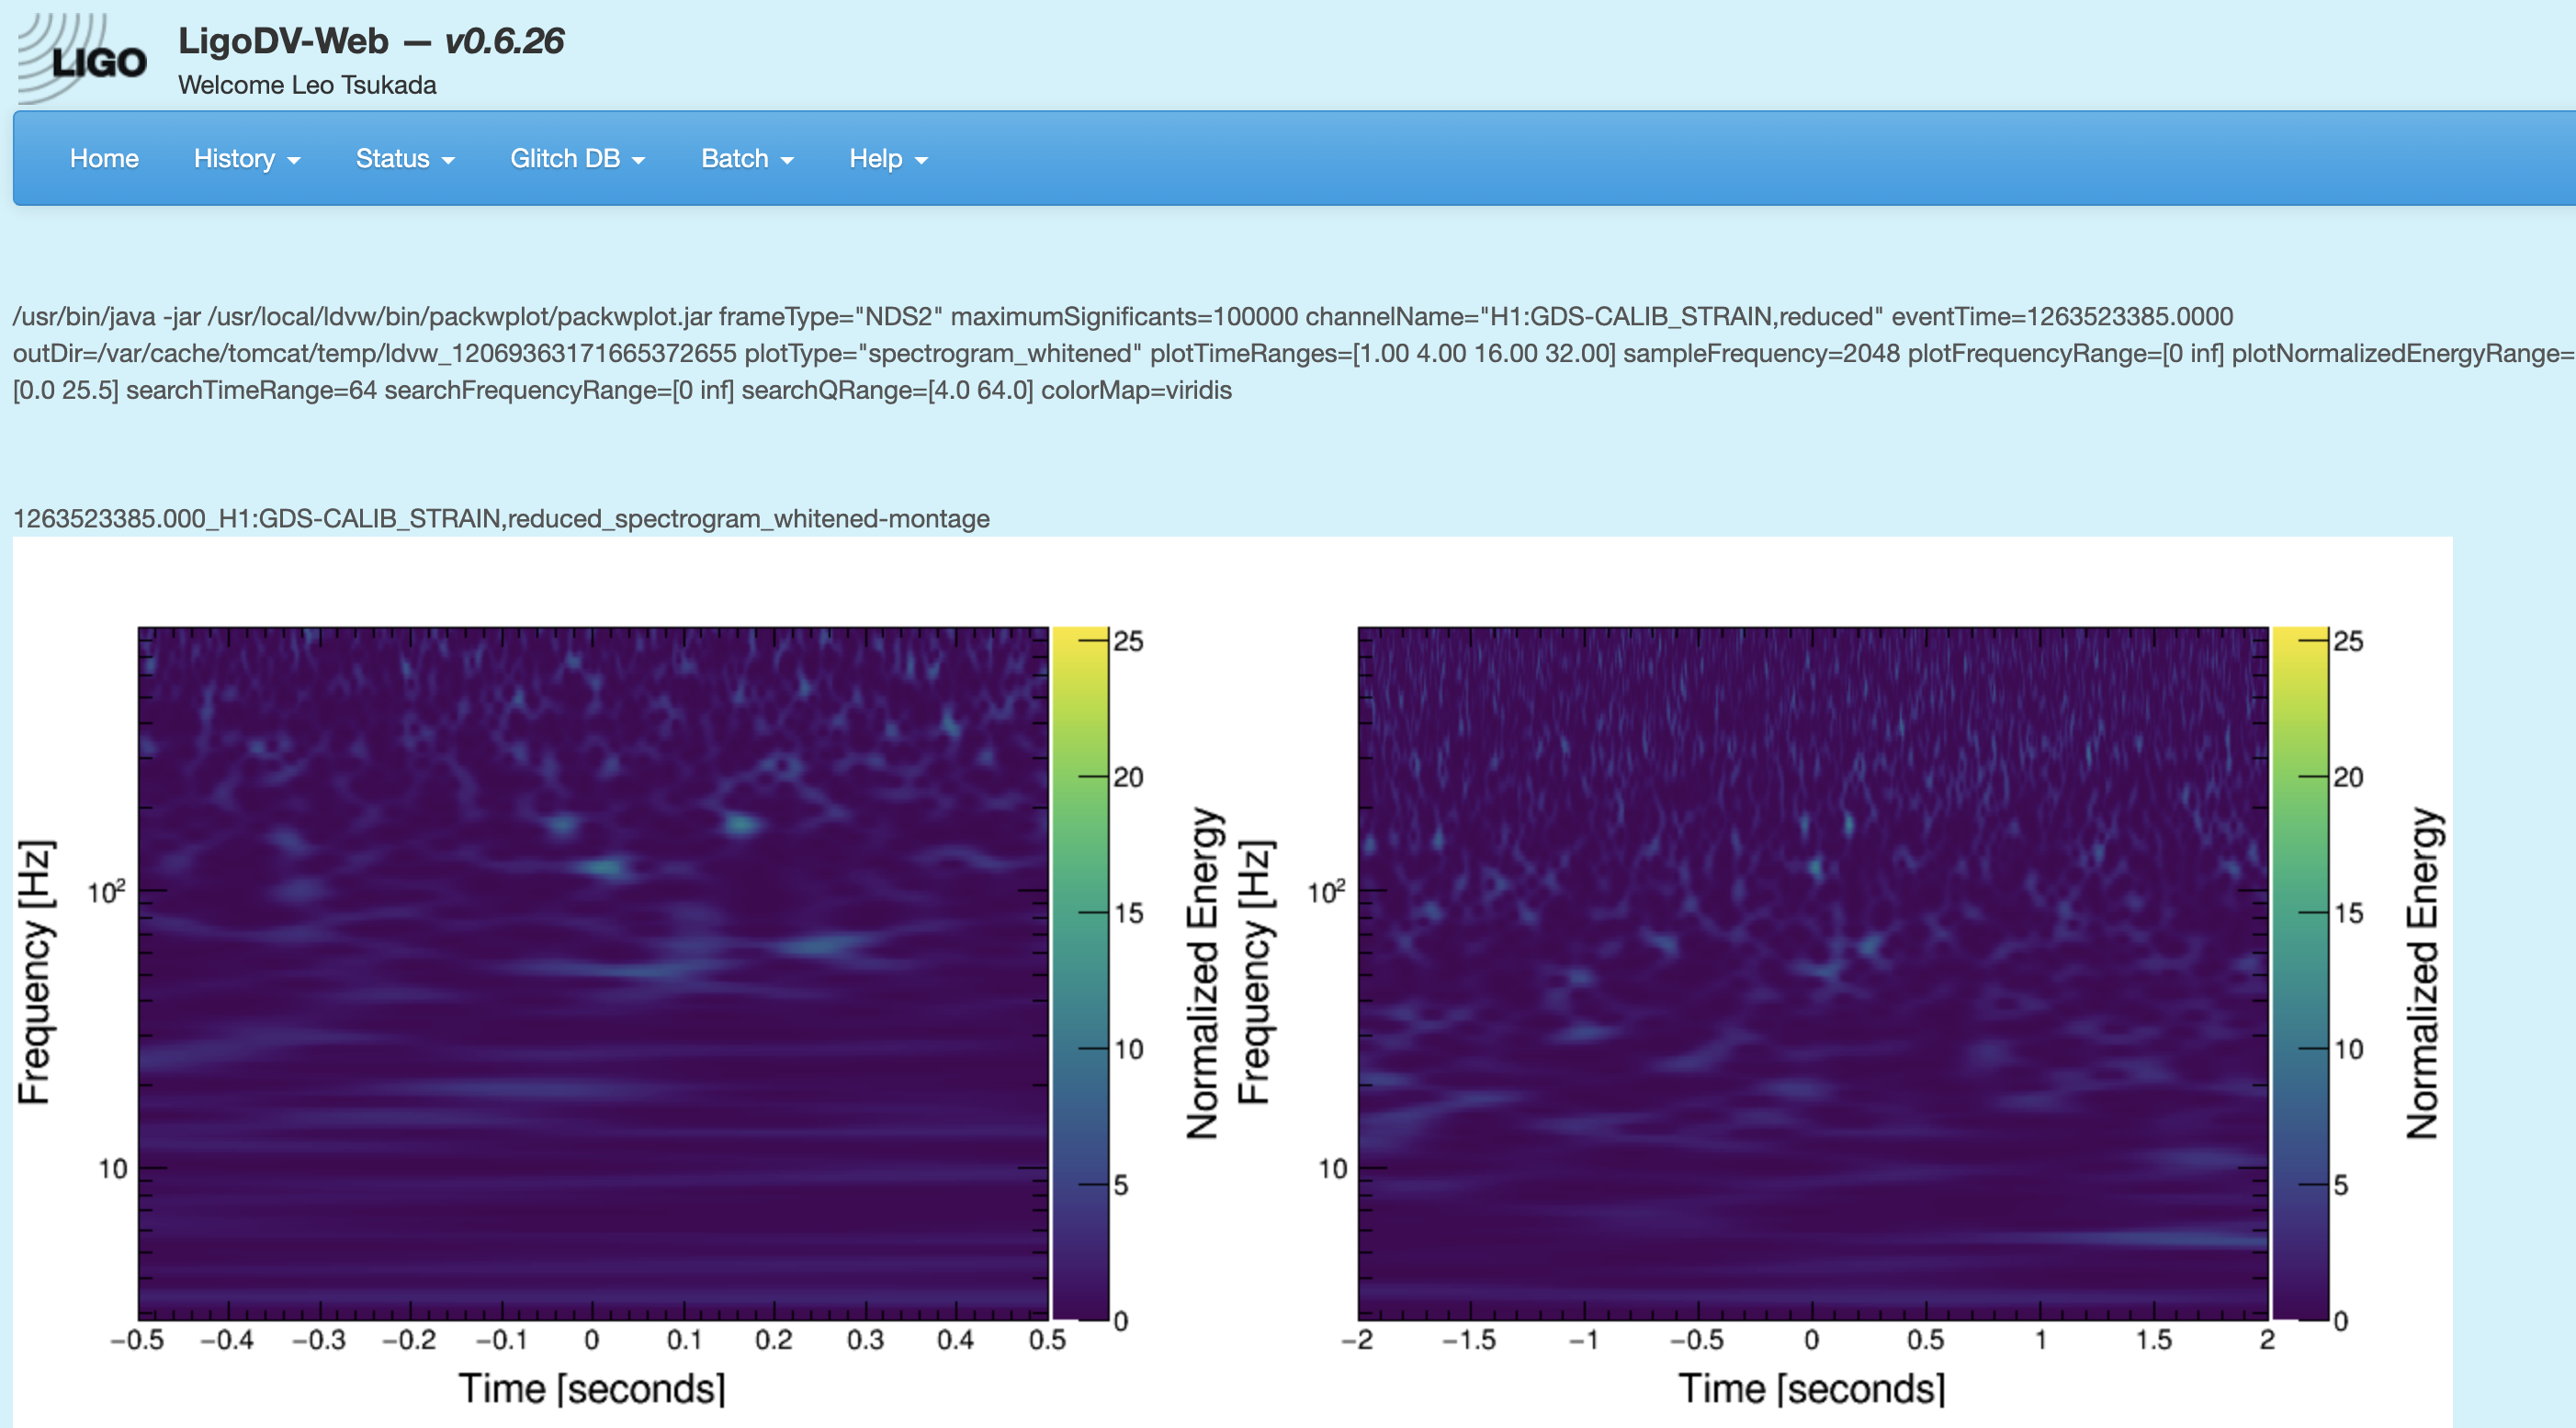
-
Right click on the plot to copy the url to the plot, and add it to the missed injections annotations.
Swapping injections for the test suite (1st of the month)
On the 1st of the month, the injections that the test suites use need to be swapped. Instructions are in:
/ligo/home/ligo.org/gstlalcbc/observing/4/b/runs/trigs.jacob_o4b/test-suite/injections/swap_injections_README.txt